Skip to content
Solution

Website monitoring, hosted in Germany

A website is not only broken once it stops answering. LIVCK checks from nine locations what visitors actually receive — and tells you afterwards what caused it.

Check interval
from 30 seconds
Free 120 s, Solo 60 s, Team and Business 30 s
Measurement locations
9 to choose from
six of them in German-speaking Europe
Assertions per service
up to 50
status code, body, JSON path, header, response time
Evidence on failure
body and headers
stored exactly as the probe saw them

In short

Website monitoring means calling a page from the outside on a fixed schedule and verifying that the answer is correct. Checking only whether the server responds misses the case where a page returns status 200 with an empty proxy error page. LIVCK therefore asserts on status code, body text, JSON fields, response headers and response time, measures from several locations at once, and only declares an outage once a majority of those locations has seen the same thing three times in a row. The public status page is built from the same stream of data — detected automatically, but published only when a human releases it.

How often and from where does LIVCK check?

Every 30 to 120 seconds depending on the plan, and from several locations at the same time. Nine are available: Frankfurt, Cologne, Nuremberg, Enge-Sande, Vienna, Geneva, Warsaw, Helsinki and New York. How many of them measure in parallel depends on the plan — two on Free and Solo, four on Team, eight on Business.

Six of the nine sit in German-speaking Europe, and that is where tools differ. A US service typically measures a German site from Northern Virginia and reports 400 milliseconds, 380 of which are the trip across the Atlantic. That number describes nothing a visitor in Hamburg will ever experience.

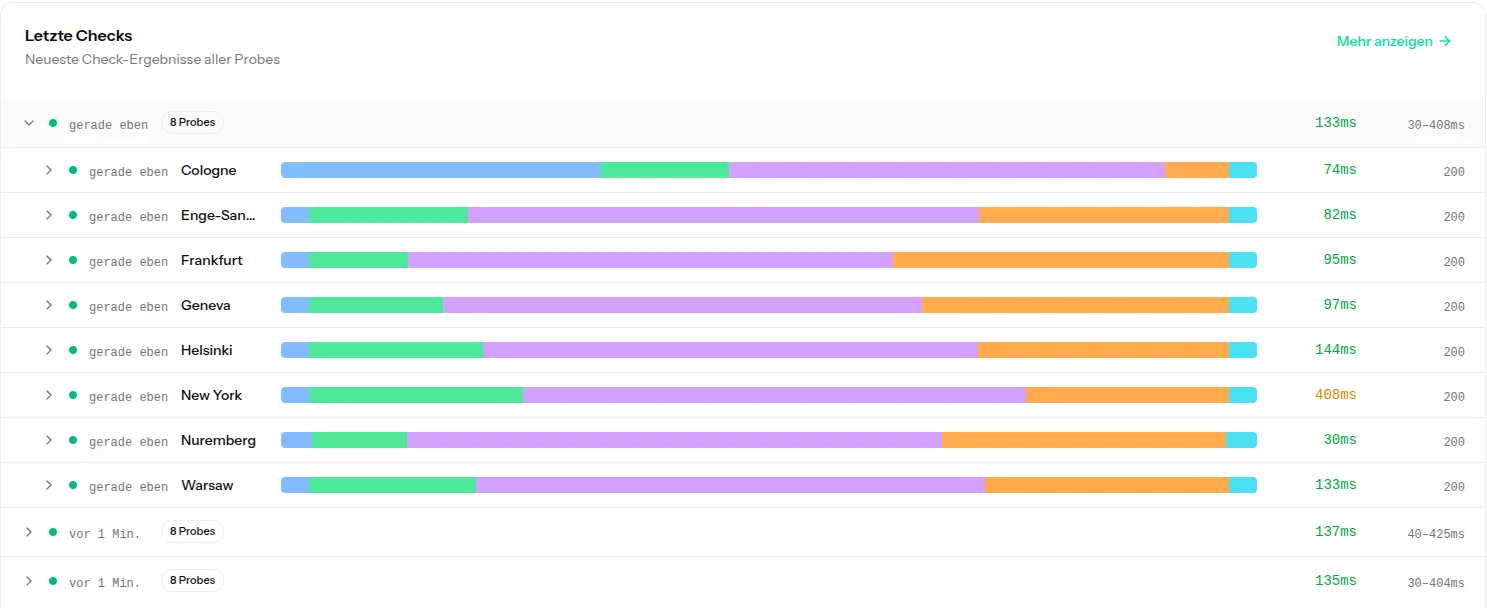
Every location keeps its own result. The console does not show an averaged state but, line by line, what each probe saw in that round — including response time and status code. If Warsaw measures 133 milliseconds and New York 408, that is exactly what you see, and it is immediately clear whether a problem is global or tied to one path.

Each location also carries a role. “Metrics and alerting” means the probe may both raise alerts and contribute to the reported availability and response time. “Alerting only” means it checks and pages, but its measurements stay out of the numbers. That is the point of the setting: New York should tell you when the site is unreachable worldwide, without dragging the response time you report to a German customer down by the transatlantic latency.
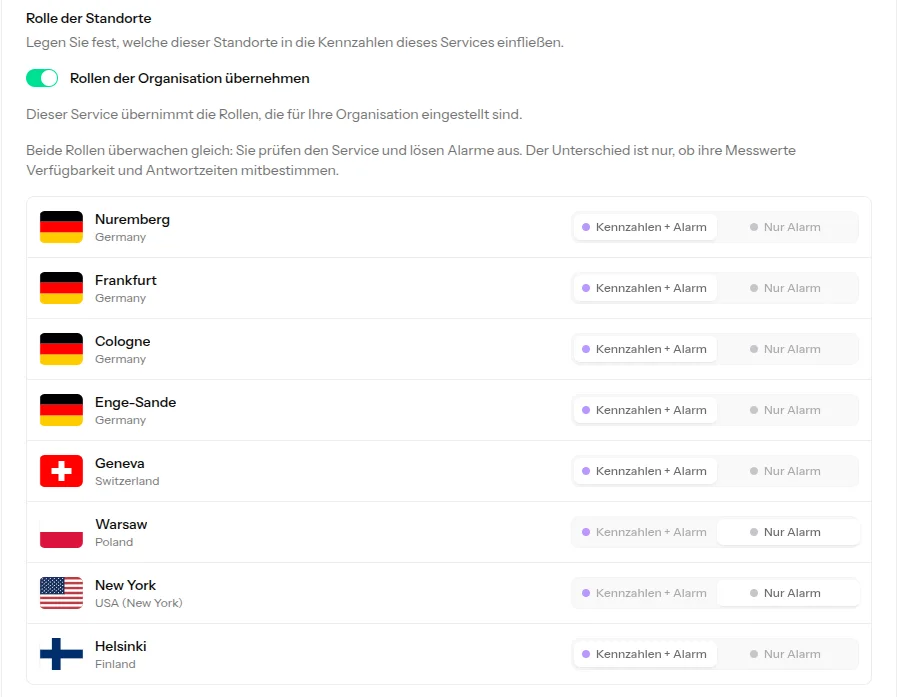
Settings panel “Role of locations” listing eight locations; Nuremberg, Frankfurt, Cologne, Enge-Sande, Geneva and Helsinki are set to metrics plus alerting, Warsaw and New York to alerting only.
Per location: alert only, or also count towards the reported numbers.
List of latest checks showing eight probes from one round — each row with location, response time, status code and a coloured bar of the request phases.
One round, eight results: every probe stays visible on its own.

How does LIVCK know a website is broken?

From assertions you write. Out of the box there is exactly one: a status code of 400 or above means down. Beyond that you can assert on response time, body text, JSON fields, response headers, redirects followed, response size, protocol version and the final URL — each assertion resolving to either “down” or “degraded”.

In practice that distinction decides more than check frequency does. An application whose database is gone rarely returns an honest error: the reverse proxy serves its own page with status 200, the CDN serves a cached copy from two days ago, the framework catches the exception and renders an empty page. All three are green to a check that only asks whether the server answers.

A single body assertion closes that gap: some text that only appears on the working page — the name of the signed-in user, the heading of the cart, a field in the JSON response. If it is missing, the page is broken, whatever status code it sends.

Two severities instead of one. “Down” means the service is unusable. “Degraded” means it answers, but not correctly — too slowly, through too many redirects, without the expected header. Both trigger, but not identically: a degraded service does not have to call someone at three in the morning.

Every assertion field of an HTTP check. This is the product list, not a selection.
Status code400 or above → down (default)is, is not, greater, less, in list, not in list
Response timeover 2000 ms → degradedgreater, greater or equal, less, less or equal
Response bodydoes not contain “Checkout” → downcontains, does not contain
JSON fieldjson.data.status is not “ok” → downis, is not, greater, less, contains, does not contain
Response headerheader.content-type contains “text/html”is, is not, contains, does not contain
Redirects followedmore than 2 → degradedis, is not, greater, less
Response sizebelow 1024 bytes → downis, is not, greater, less
HTTP protocolis not “HTTP/2.0” → degradedis, is not, contains, does not contain
Final URL after redirectscontains “/maintenance” → downis, is not, contains, does not contain

The JSON path is a dot path into the response — data.status, items.0.id, and items.# for the length of an array. Headers are compared case-insensitively. How many assertions a service may carry depends on the plan: 5 on Free, 15 on Solo, 30 on Team, 50 on Business.

What if the endpoint needs authentication, custom headers or mTLS?

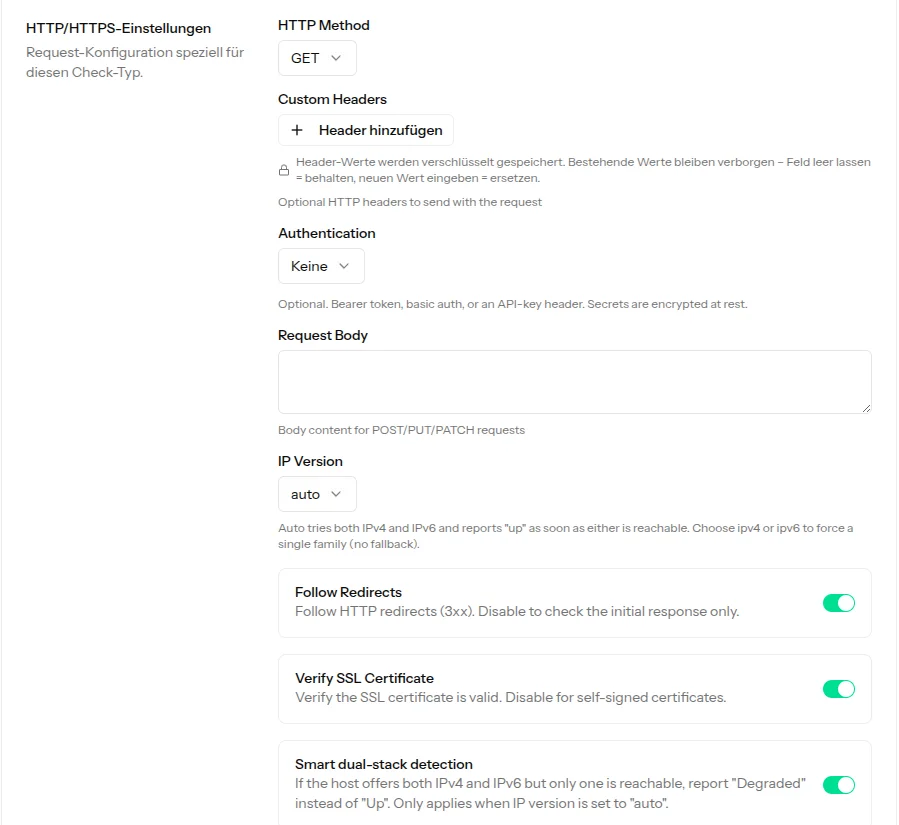
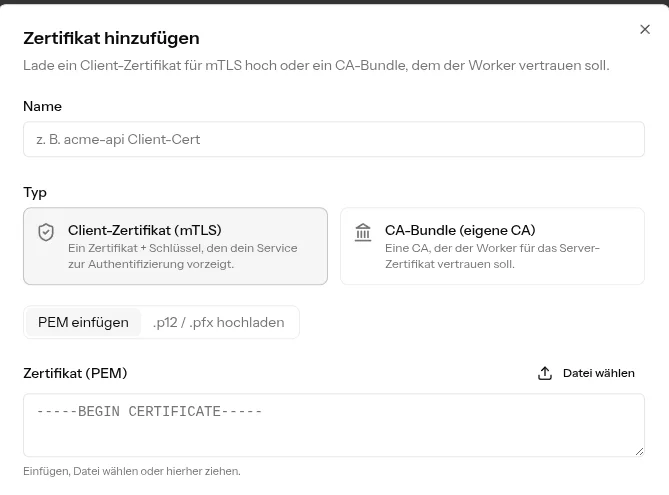
Then you configure it that way. LIVCK sends any HTTP method, arbitrary custom headers, a request body, and optionally a bearer token, basic auth or an API-key header. For endpoints behind mutual TLS you can store a client certificate, and for internal authorities your own CA bundle.

That last point looks minor and is expensive. A host with an AAAA record whose IPv6 address does not answer counts as reachable to most checking services — they silently fall back to IPv4, just like most browsers do. For the share of visitors on IPv6-only connections the site is dead anyway, and nobody finds out. With dual-stack detection enabled that becomes a visible state instead of a blind spot.

Client certificates are pasted as PEM or uploaded as a .p12 or .pfx file, with an optional passphrase. The private key is stored encrypted and never leaves the server in clear text. Stored certificates are also watched for expiry — the reminder arrives before a check starts reporting a fake outage caused by an expired client certificate.

If you run an internal certificate authority, upload its bundle as a CA. The probe then trusts that issuer without having to disable certificate verification altogether — the difference between “I trust this CA” and “I stopped checking”.

Method and body
GET, POST, PUT, DELETE, PATCH, HEAD or OPTIONS, plus a request body of up to 10,000 characters — enough to issue a real query instead of merely knocking on the door.
Custom headers
As many as you need. Values are stored encrypted and never shown in clear text again: leaving the field empty keeps the value, entering a new one replaces it.
Authentication
Bearer token, basic auth, or an API key in a header of your choosing. Those secrets are encrypted at rest too.
Redirects
Follow or do not follow. Not following checks the first response — the only way to make a redirect itself the thing under test.
Certificate verification
Can be switched off so an endpoint with a self-signed certificate can be monitored without painting the check permanently red.
IP version
auto, IPv4 only, or IPv6 only. “auto” reports up as soon as either family answers.
Smart dual-stack detection
If the host offers both families but only one is reachable, LIVCK reports “degraded” instead of “up”.
HTTP settings of a service: method GET, a button for custom headers, authentication, request body, IP version auto, plus toggles for redirects, certificate verification and smart dual-stack detection.
The complete request configuration of an HTTP check.
Dialog “Add certificate” offering a client certificate for mTLS or a CA bundle, and the input modes “paste PEM” and “upload .p12 / .pfx”.
Client certificate or private CA — pasted as PEM or uploaded as a file.

How are false alarms prevented?

In four stages: retries at the location, confirmations over time, a majority across locations — and the rule that nothing goes public on its own. Only when all four are satisfied does an incident exist, and even then it starts out internal.

That last stage saves the most trouble and never shows up in feature matrices. A detection system that publishes automatically turns every false alarm into a public outage notice to every subscriber — and that cannot be taken back. In LIVCK, automatic publishing is off by default.

All thresholds are defaults, not laws of nature. They live in a detection policy that can apply to a single service, to every service carrying a given tag, or to the whole organisation. If you monitor something that is supposed to be reachable from one country only, you adjust the majority rule there — without changing anything for the rest.

Retry
A failed check is retried immediately before the result counts at all. Two attempts by default, adjustable per service.
Confirmation
Three consecutive failing results, otherwise no incident. A single blip evaporates.
Majority
More than half of the measuring locations have to see the same thing. A network node in trouble does not create an incident — it creates a conspicuous row in the report.
Recovery
Two confirmations are enough to call it recovered. Flap detection catches services that bounce between up and down every minute instead of alerting each time.
Publication
A detected incident is an internal matter. Whether it appears on the public status page and reaches subscribers is a human decision.

Why was the site slow?

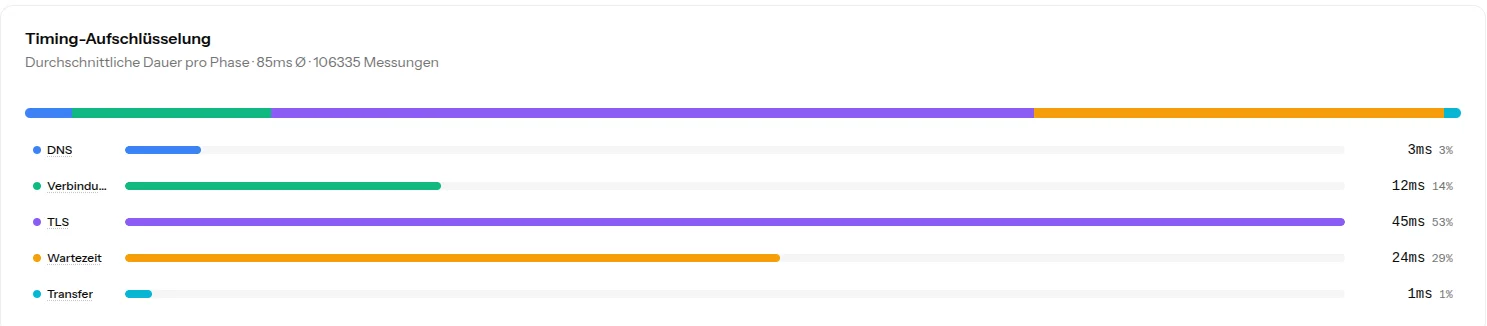
Because LIVCK breaks every request into its phases: DNS resolution, connection, TLS handshake, waiting for the first byte, and transfer. Only that split tells you whether the problem sits in the network, in the certificate, or in the application.

An average of 85 milliseconds is not a diagnosis. The breakdown below is: 45 milliseconds go to the TLS handshake, 24 to waiting for the first byte, 12 to establishing the connection, 3 to DNS and a single one to transfer. The application is not the bottleneck here — more than half the time passes before it is even asked.

When the shape shifts, so does the cause. Growing wait time means the server is thinking too long. A growing DNS share points at the resolver or at short TTLs. A growing connection share suggests packet loss or a worse route. A growing TLS share means something changed about the certificate or its chain. Without that separation all you can say is that it got slower.

The same split exists per location over time. A line drifting away from the others is a path problem; if all of them rise together, it is the application.

Timing breakdown bar showing DNS 3 ms, connection 12 ms, TLS 45 ms, wait 24 ms and transfer 1 ms, at an average of 85 ms across 106,335 measurements.
Average duration per phase — here the TLS handshake dominates, not the application.
Line chart of response time per measurement location over seven days; one line sits permanently around 400 ms while the others stay below 150 ms.
Response time per location. The upper line is New York — a distance, not a defect.

What does the report look like after two weeks?

Availability, response time as mean and as 95th and 99th percentile, the ratio of outlier to mean, plus MTTR, MTTA and MTBF, the longest single outage, availability per location, and the distribution of failure causes.

Mean, P95 and P99
The mean hides outliers. Only the 95th and 99th percentile show what the slowest twentieth and the slowest hundredth of requests experienced.
Tail (P99 divided by mean)
A value of 1.7 means the slowest requests take almost twice as long as average. If it rises while the mean stays flat, the application has become uneven — the classic early warning.
MTTR, MTTA, MTBF
Mean time to recovery, to human acknowledgement, and between incidents. The three numbers a review asks for.
Availability per location
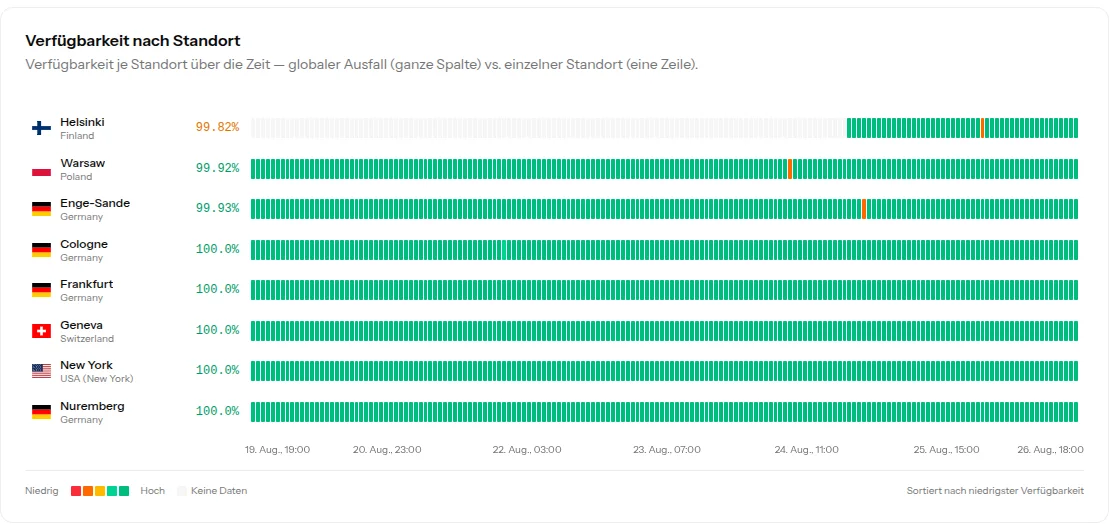
A whole column red means a global outage. A single row red means only that location — and then it is usually the path there, not your site.
Failure causes and status codes
Why checks failed, grouped by cause, plus the distribution of every response status code in the period.
Metrics bar: uptime 100.00 percent, mean response time 84 ms, P95 123 ms, P99 145 ms, tail 1.7x, 3 incidents; below it MTTR 3 minutes, MTBF 2 days 8 hours, longest outage 4 minutes.
Availability, latency distribution and process metrics in one view.
Bar matrix of availability by location with eight rows; Helsinki shows 99.82 percent and an orange stripe, the others sit between 99.9 and 100 percent.
A whole column red is a global outage; a single row red is a path problem.
Two reports side by side: failure causes with check failed 23 times, request timed out twice, connection timed out once, and a donut chart of HTTP status codes across 146,659 responses.
Failure causes and status code distribution — the basis of any post-mortem.

How far back the reports reach depends on the plan: 30 days on Free, 90 on Solo, 180 on Team and 365 on Business.

What evidence is left after an outage?

The response itself. When a check fails, LIVCK stores the response body and the response headers exactly as the probe saw them at that moment — together with the location, the timestamp and the state change that goes with it.

That is the difference between “the site was down at 3:12” and “at 3:12 the site served a 502 page from the reverse proxy in Warsaw, with a header pointing at the wrong backend pool”. Without that evidence, debugging the next morning starts with an attempt to reproduce a state that is over, and usually ends in a guess.

This evidence is kept for seven days on Solo, thirty on Team and ninety on Business. The Free plan does not store it.

Who gets woken up, and when?

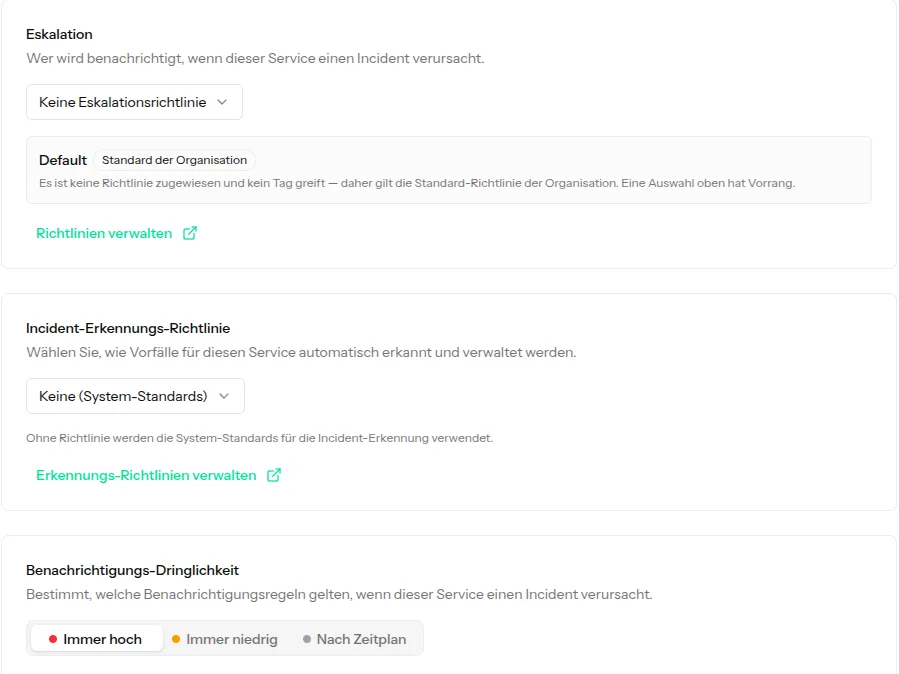
An escalation policy decides that: stages with a delay between them, a target per stage, and an acknowledgement that stops the chain. If nobody responds, it moves on to the next stage until somebody does.

A target can be a person, a team, an on-call rotation or a chat channel. The rotation resolves who is actually on duty at the moment of the alert — an override entered an hour earlier counts.

How someone is reached is up to them: email, SMS, voice call, WhatsApp. Organisation-wide channels exist for Slack, Microsoft Teams, Telegram, Discord and arbitrary webhooks.

And not every service deserves the same noise. Urgency is set per service to always high, always low, or by schedule. A test system nobody cares about at night gets an email instead of a phone call — without having to switch monitoring off for it.

Alerting tab of a service with escalation policy, incident detection policy and the urgency choice between always high, always low and by schedule.
Detection, escalation and urgency are set per service — or inherited from the organisation.

And how does this become a status page?

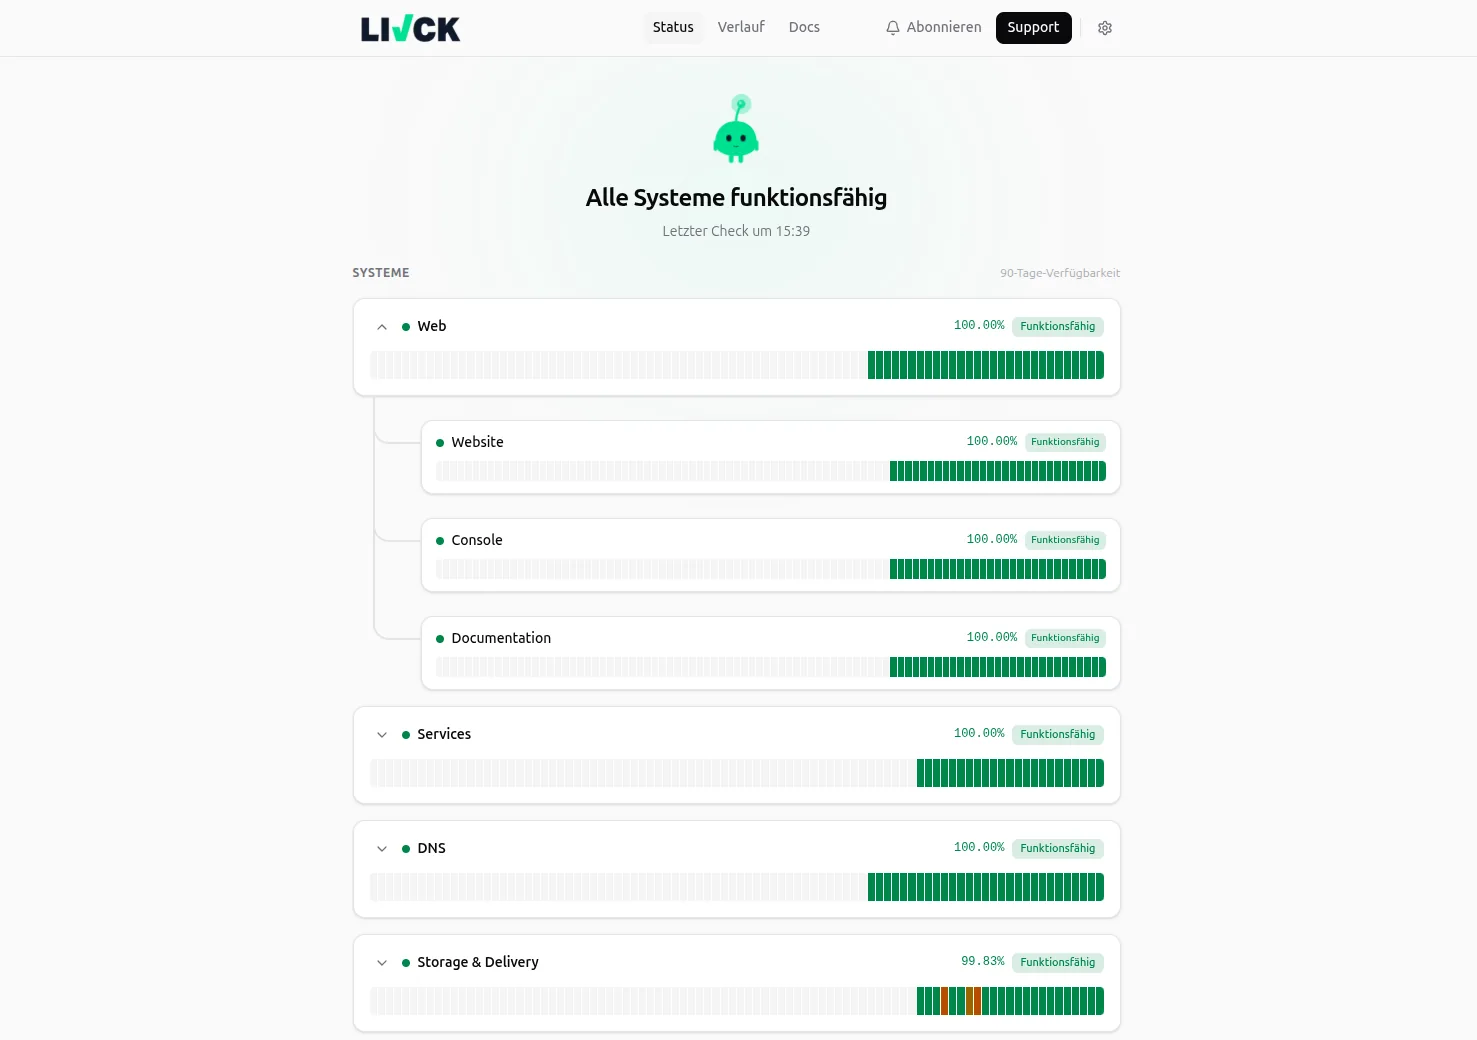
From the same data. A monitored service can appear as a component on a public status page; detected incidents, planned maintenance and the history of availability and response time show up there as soon as they are released.

This is why monitoring and status page are one tool in LIVCK rather than two. Separating them means maintaining the same fact twice during an incident — once in the monitoring system, once by hand on the status page, under time pressure and usually incompletely.

A custom domain is included in every plan, the free one as well. Subscribers can follow individual components rather than the whole page, and they are only notified once an incident has been published.

Public LIVCK status page showing overall state, a list of components and the history of recent days.
The same services, in public: the state is not maintained twice.

What LIVCK is not the right tool for

LIVCK calls HTTP endpoints and evaluates their response. That is precise, but it is not everything you can measure about a website. For these four jobs, another tool is the right one:

Click-through journeys in a real browser

No JavaScript is executed and no checkout is clicked through. Testing a multi-step checkout as a whole needs synthetic browser transactions.

Load times of real visitors

Measurement happens from our locations, not in your visitors’ browsers. LIVCK does not provide Core Web Vitals from real traffic, which is what real user monitoring means.

Page quality and SEO

No Lighthouse score, no broken-link scan, no crawl of the whole domain. What gets checked is what you define as the thing under test.

Screenshots of the failure

What is captured is the HTTP response with body and headers, not an image of the rendered page.

These four are stated here because otherwise they cost you a trial. A tool that supposedly does everything only postpones the disappointment.

How to set it up

From an empty account to the first check worth trusting, it is five steps.

  1. Create the service

    Pick HTTP/HTTPS, enter the target URL, confirm interval and timeout. For the first run the default is enough: status code 400 or above means down.

  2. Sharpen the assertions

    Add an assertion on text that only exists on the working page, or on a field of the JSON response. This is the step that catches the 200-with-error-page.

  3. Choose locations and roles

    Which locations measure, and which of them count towards the numbers. Keeping distant locations on “alerting only” keeps the reported response time honest.

  4. Assign an alerting path

    Pick an escalation policy or inherit the one from the organisation, then set the urgency. Skip this and detection works while nobody gets woken up.

  5. Put it on the status page

    Assign the service as a component of a status page. From then on the public view is built from the same measurement — still published only on release.

Which plan limits matter here

Five limits matter for website monitoring. Everything else in a plan concerns other jobs.

LimitFree freeSolo €19 / monthTeam €49 / monthBusiness €119 / month
Shortest check interval Determines how fast an outage can be noticed at all.120 s60 s30 s30 s
Locations in parallel Chosen from nine. More locations means a more reliable majority.2248
Assertions per service Status code, body, JSON, header, response time — one row each.5153050
Measurement retention How far back reports and histories reach.30 days90 days180 days365 days
Evidence retention Response body and headers from the moment of failure.7 days30 days90 days

Prices are net, plus 19 % German VAT. LIVCK is a business-to-business offering.

All plans in detail

Frequently asked questions

What does website monitoring with LIVCK cost?
The Free plan monitors 20 services every 120 seconds from two locations and stays free, with no credit card. Above it are Solo at 19 euros, Team at 49 and Business at 119 euros net per month; they differ mainly in interval, number of locations, assertions per service and retention.
How quickly will I hear about an outage?
An incident is raised after three confirmed failures. At a 30-second interval that is roughly a minute and a half, at 120 seconds roughly six minutes. The delay is deliberate — it is the price of a single blip not waking anyone. If you want it shorter, lower the number of confirmations in the detection policy.
Does LIVCK notice when a page is broken but returns 200?
Yes, if an assertion points at it. Status codes alone are not enough, because error pages from reverse proxies, CDNs and frameworks frequently answer with 200. An assertion on text from the working page, on a JSON field, or on response size closes that gap.
Can LIVCK check pages behind basic auth, tokens or mTLS?
Yes. Bearer tokens, basic auth and API-key headers are built in and stored encrypted. For mutual TLS you can store a client certificate as PEM or as a .p12 or .pfx file, and a private CA bundle for internal authorities.
Does LIVCK check over IPv6?
Yes. The IP version is set to auto, ipv4 or ipv6. On top of that there is smart dual-stack detection: if the host offers both families but only one is reachable, that is reported as degraded instead of quietly falling back to the working family.
Is a detected outage published to my status page automatically?
No. Automatic publishing is off by default. A detected incident starts as an internal record; only on release does it appear publicly, and only then are subscribers notified. If you want it the other way round, enable it per detection policy.
Where is the data processed?
The application runs on servers in Germany and the measurement data stays in the EU. The data processing agreement and the list of sub-processors are published.
Can I self-host website monitoring?
Yes, as the self-hosted edition via Docker Compose, licensed rather than billed per service. The difference is the measurement network: checks then run from your own infrastructure, not from the nine distributed locations of the cloud.

Your first check runs in two minutes

Free plan, 20 services, no credit card. If it does not fit, there is nothing to cancel.

Everything on this page reflects the feature set of LIVCK Cloud as of 26 August 2026. Plan limits can change — the pricing page is authoritative.